Alternatives for retrieving sensor data from Arduino compatible microcontrollers into R


Have you ever wanted to get your own real-world data using sensors? With the advent of the Open-Source Hardware movement, this has become more accessible for the general public, microcontrollers and sensors have become cheaper and easier to program with human-friendly languages like Arduino (C++) and MicroPython (Python), so now anybody can produce its own real-world sensorial data, but, there is still a problem, How do we get this data into R so we can analyze it?
Depending on your application’s requirements you could choose among a plethora of options. For example, if you only need data on batches and you can have easy physical access to your device, you could simply add an SD card module to your project and log the data to a .csv file on an SD card but, that wouldn’t be fun, isn’t it? A much cooler solution would be to retrieve data remotely and preferably wirelessly, don’t you think?. Let’s explore some options.
Serial Connection
If you have never thought about getting data from microcontrollers before, I bet the first thought that comes to your mind, is to somehow directly connect the microcontroller with R to get the data, but this is currently the most technically challenging option, it can be done using a serial connection between the microcontroller and your computer, but as far as I know, there is only one R package implementing this and only runs on POSIX-compatible systems (so no Windows).
I can’t test this approach myself since I don’t have a physical Linux or macOS machine to connect a microcontroller to, so for this case, I’m just going to link to a blog post by @haozhu233 (the package author) showcasing its functionality.
If your application requires real-time data acquisition or very low latency this might be your only option and you may want to dive deeper into this.
Streaming arduino sensor signals right into @rstudio! I wonder if there is really anything #rstats can’t do 😎😎😎 pic.twitter.com/nT6q6TT6xc
— Hao Zhu (@haozhu233) January 25, 2019
Writing to a SQL server
There are two ways of doing this, one is to directly connect the microcontroller to the database and the other is to use another service to pull data from the microcontroller and write it into the database.
The first option is harder to accomplish, as far as I know, there is only one Arduino library that provides a SQL connector for MySQL servers but, there are no already-made solutions for other SQL servers and although you could write your own connector for other Open Source SQL servers (like PostgreSQL), that would require a considerable amount of technical skills.
The second option is easier to implement, and my personal favorite.
The first step is to broadcast the data from the microcontroller, one way of doing this is to implement a simple web server on the microcontroller itself and serve the data on a suitable format like HTML, JSON or CSV.
This is a simple example of an Arduino Sketch for an ESP8266 board (Wemos D1 mini) and DS18B20 temperature probe sensors, that serves HTML and JSON outputs over a web server.
The second step is to pull the data out of the microcontroller and into a SQL server, there are a lot of approaches and languages you can use to implement this part but obviously we are going to use R. You can write an R script that connects to the microcontroller, retrieves the data and writes it into a SQL server, and schedule the script with a cron job.
#! /usr/bin/env Rscript

# DATA ADQUISITION##############################################################
raw_data <- rjson::fromJSON(file="http://192.168.0.102/reading.json")
current_time <- as.character(Sys.time())

# PARAMETERS ###################################################################
current_location = "some_place"
point_names = c("probe0" = "measurement_point_0",
                "probe1" = "measurement_point_1",
                "probe2" = "measurement_point_2")

# LIBRARIES ####################################################################
library(dplyr)

# DATA CLEANING ################################################################
tidy_data <- as_tibble(raw_data) %>%
    tidyr::gather(measurement_point, value) %>%
    mutate(time = current_time,
           location = current_location,
           variable = stringr::str_extract(measurement_point, "^.+(?=-)"),
           measurement_point = stringr::str_extract(measurement_point, "(?<=-).+$"),
           measurement_point = stringr::str_replace_all(measurement_point, point_names)
           ) %>%
    select(time, location, variable, measurement_point, value)

# LOAD DATA ####################################################################
con <- dbConnect(drv = odbc::odbc(),
                 driver = 'PostgreSQL ANSI',
                 server = 'localhost',
                 database = 'sensors',
                 port = 5432,
                 uid = Sys.getenv('MY_UID'),
                 pwd = Sys.getenv('MY_PWD'),
                 encoding = 'utf8')

DBI::dbAppendTable(conn = con,
                   name = 'sensors_data',
                   value = tidy_data)

odbc::dbDisconnect(con)

unlink(x = "*.log", force = TRUE)
Now that you have the data into a SQL server, you are at one SQL query away of getting it into R
library(odbc)

con <- dbConnect(drv = odbc::odbc(),
                 driver = 'PostgreSQL ANSI',
                 server = 'localhost',
                 database = 'sensors',
                 port = 5432,
                 uid = Sys.getenv('MY_UID'),
                 pwd = Sys.getenv('MY_PWD'),
                 encoding = 'utf8')

query <- "
    SELECT *
    FROM public.sensors_data
    "

raw_data <- dbGetQuery(
  conn = con,
  statement = query
)

dbDisconnect(con)
What makes this approach my personal favorite is that it is fairly easy to implement, very flexible and allows you to implement almost any security measure you might need.
Using the MQTT protocol
For more resource-constrained applications you can use a similar approach to the previous one, but with a different technology, the MQTT protocol is ideal for low power devices over slow and unreliable connections, moreover, this is also a way to get data from LoRa networks like the publicly available TTN (The Things Network) which provides an API over MQTT, giving you access to a low-power wide-area network for remote sensor deployment over greater distances.
This approach also allows you to write data to a SQL server like in the previous example but, a more interesting application for this would be to get instant status updates to show on dashboards or shiny apps. Consider this simple shiny app that receives a message from a simulated remote sensor and updates the color of a circle accordingly, you can update the temperature value of the simulated sensor by sending an MQTT message to the test topic from a system terminal on any computer with this command mosquitto_pub -h test.mosquitto.org -t simulated_sensor -q 1 -m 25.9 -r and see how the color changes.
✏️ In order for this to work you need to have the
mosquittoclient installed in your system.
sudo apt install mosquitto-clientslibrary(shiny)
library(ggplot2)
library(rmqtt) # This package is just a simple wrapper for an MQTT client using
# system() calls, you need to have the mosquitto client installed
# in your system for this to work.
# Initialize Simulated Sensor
mqtt_topic_publish(
topic = "simulated_sensor",
message_to_send = "24.9",
host = "test.mosquitto.org",
port = 1883,
qos = 1,
retain_message = TRUE
)
ui <- fluidPage(
titlePanel("Dashboard"),
mainPanel(
h2("Temperature Indicator"),
plotOutput("status_indicator")
)
)
server <- function(input, output, session) {
get_color <- function() {
message <- mqtt_topic_subscribe(
topic = "simulated_sensor",
host = "test.mosquitto.org",
port = 1883,
qos = 1,
intern = TRUE,
num.messages = 1
)
if (as.numeric(message) > 25) {
color = 'red'
} else {
color = 'green'
}
return(color)
}
pollData <- reactivePoll(100, session,
checkFunc = get_color,
valueFunc = get_color
)
output$status_indicator <- renderPlot({
ggplot(data = data.frame(x = 1, y = 1), aes(x, y)) +
geom_point(size = 50, color = pollData()) +
scale_x_discrete() +
scale_y_discrete() +
theme_void() +
theme(axis.title = element_blank())
})
}
shinyApp(ui = ui, server = server)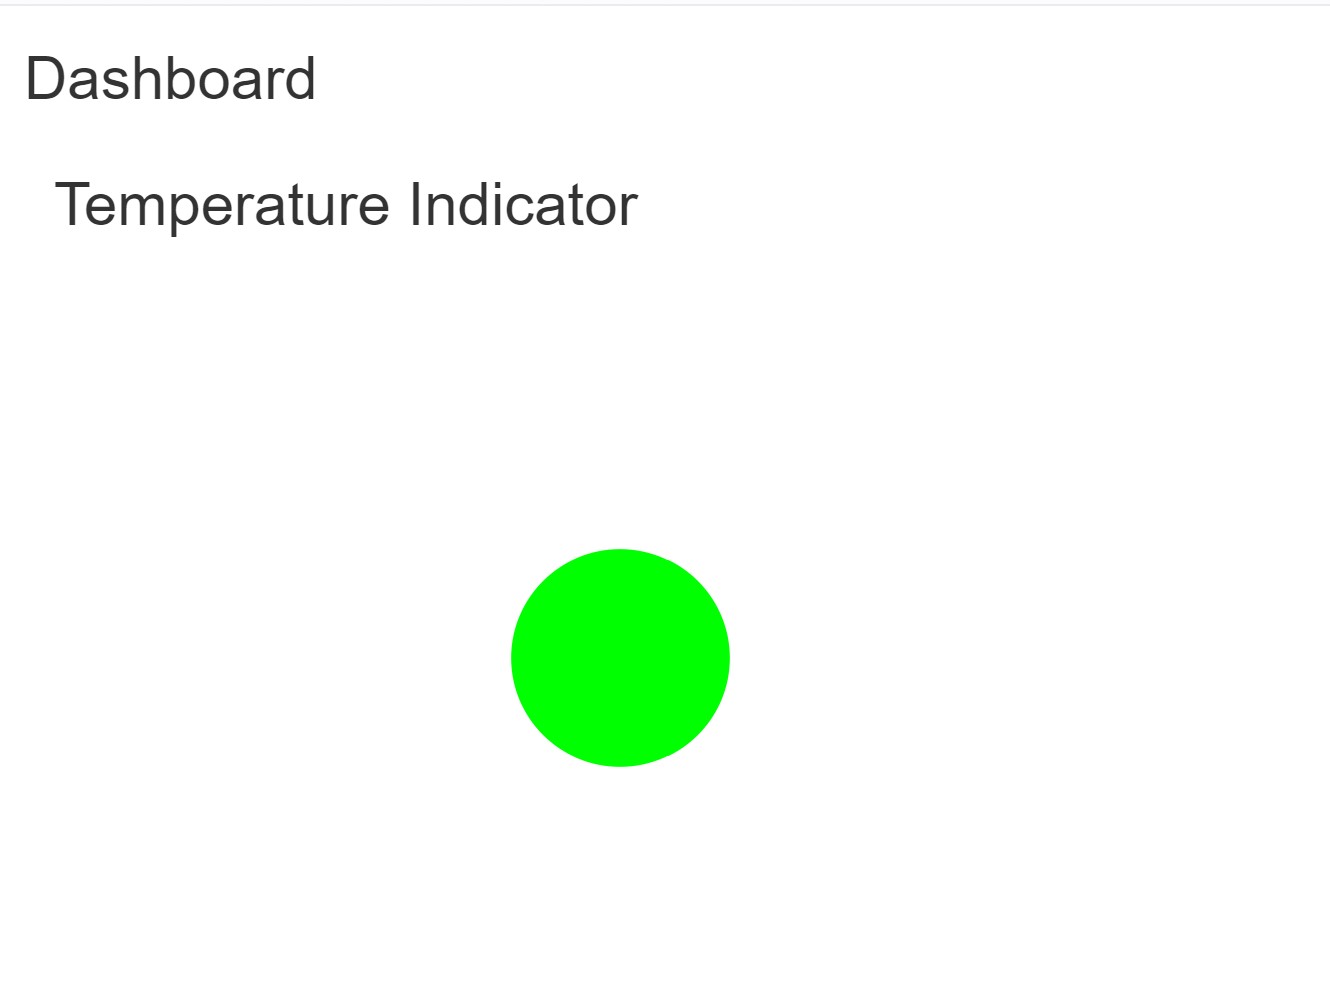
If you are interested in testing this, here is a GitHub Gist with the Arduino Sketch for an ESP8266 board whit a DS18B20 temperature probe sensor that can update the values in the example app.
I know this doesn’t look very interesting right now but consider the implications. You could be getting instant updates in your dashboard from sensors deployed at kilometers downrange and you could even control remote actuators from your shiny app by sending an MQTT message from it with the click of a button!
The downside of this method is that you need to set an MQTT broker (you should not abuse the publicly available ones that are intended for testing), but it can be done for no or little money on a Raspberry Pi or an EC2 AWS instance.
Disclaimer
I want to make clear that this is by no means an exhaustive list, there are other alternatives and countless variations of the ones presented here so if none of these fitts your particular project’s needs, just keep looking, very likely someone has come up with a more suitable method.
✏️ If you want to see a detailed step by step example of any of these options, write it on the comments and I’ll try to make a blog post about it.